U.S. import growth by volume increased to 6.9% year over year in February, overcoming the downward pressure created by the Lunar New Year holiday. Asian routes drove that growth, with imports originating ports other than China up by 17.2% year over year. Chinese ports followed, increasing i... Read more →
Shipments Processed
-
9,165,842Shipments Processed (U.S. Imports)
Shipments by Month
TEUs by Month
Research
Suppliers
Top ZIMU Suppliers
Buyers
Vessels
Top ZIMU Vessels
Foreign Ports
Top ZIMU Foreign Ports
- Yantian
- Shanghai
- Kingston
U.S. Ports
Top ZIMU U.S. Ports
- New York Newark Area
- Port of Long Beach
- Georgia Ports Authority
Contact
Phone | |
Address | |
City | |
Country Name |
Shipment Statistics for Zim Integrated Shipping Services Ltd
-
9,165,842Total shipments
-
20,521,450 TEUsTotal volume
-
2.24 TEUsAverage shipment size
月度货运次
Shipment Market Share (%)
TEUs by month
TEU Market Share (%)
Recent Panjiva Research about Zim Integrated Shipping Services Ltd
ZIM leads 2M, Ceva imports surge in November
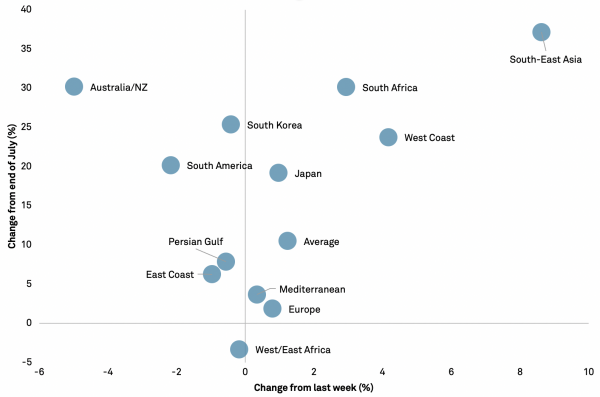
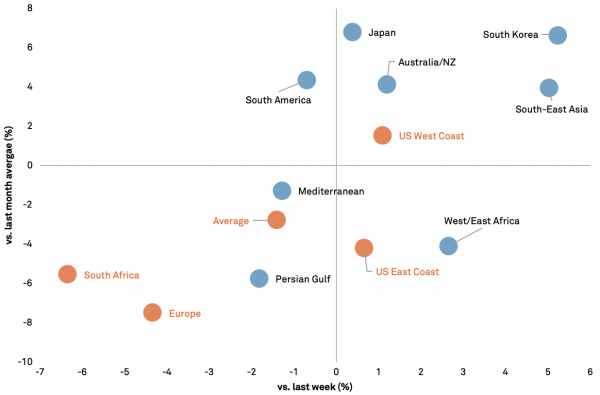
Carrier and forwarder markets in November were affected by the continuing rise in ocean freight rates, up 1.2% on average after a lull in October. China to U.S. west coast routes were particularly affected, up 4.2% week to week as of Dec 10, and up 23.8% since the end of July. Other routes ... Read more →
ZIM, MSC lead 2M import growth in October
Carriers have continued to benefit from the surge in imports, increasing profits over previous years due to a positive volume and rate environment. This totaled 48.1 billion in Q3 and will likely impact the strategy and plans of carriers into the new year. Carriers are likely warry of allow... Read more →
ZIM, Matson lead carriers, DP-DHL and K+N lead forwarders in slowing September
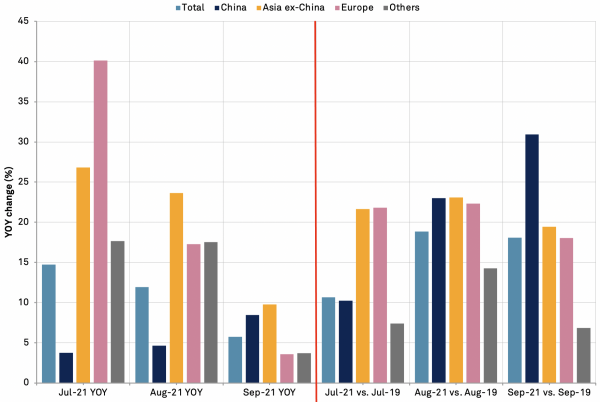
Carriers and forwarders showed reduced import momentum when comparing September to the prior three months ending in Aug 31. Slowdowns were driven by a continued decrease in import growth from Asia excluding China and Europe, slowing to 9.8% and 3.6% year over year respectively. Imports load... Read more →
Hapag-Lloyd, Maersk flag strained system, new services as growth slows
The container shipping lines had a bumper Q2’21 and remain confident for the rest of 2021 and into early 2022. The EBITDA reported by Maersk and Hapag-Lloyd rose by 198% and 177% year over year in Q2’21. While largely down to higher rates there’s a continued contribution f... Read more →
ZIM Shipping, MSC face attention in FMC’s surcharge inquiry
The U.S. Federal Maritime Commission has launched an “expedited inquiry” into port congestion charges, targeting eight container shipping which represented 50.2% of U.S. seaborne imports of containerized freight in Q2’21. That follows: a surge in “freight all kinds... Read more →
Shipping alliances face risk of regulatory wave from Biden’s competition order
President Biden’s “Promoting Competition in the American Economy” Executive Order includes measures relating to the shipping and rail segments of the logistics industry. The provision for shipping appears modest and calls on the Federal Maritime Commission to “ensure... Read more →
Congestion, carbon costs overshadow continued container shipping boom
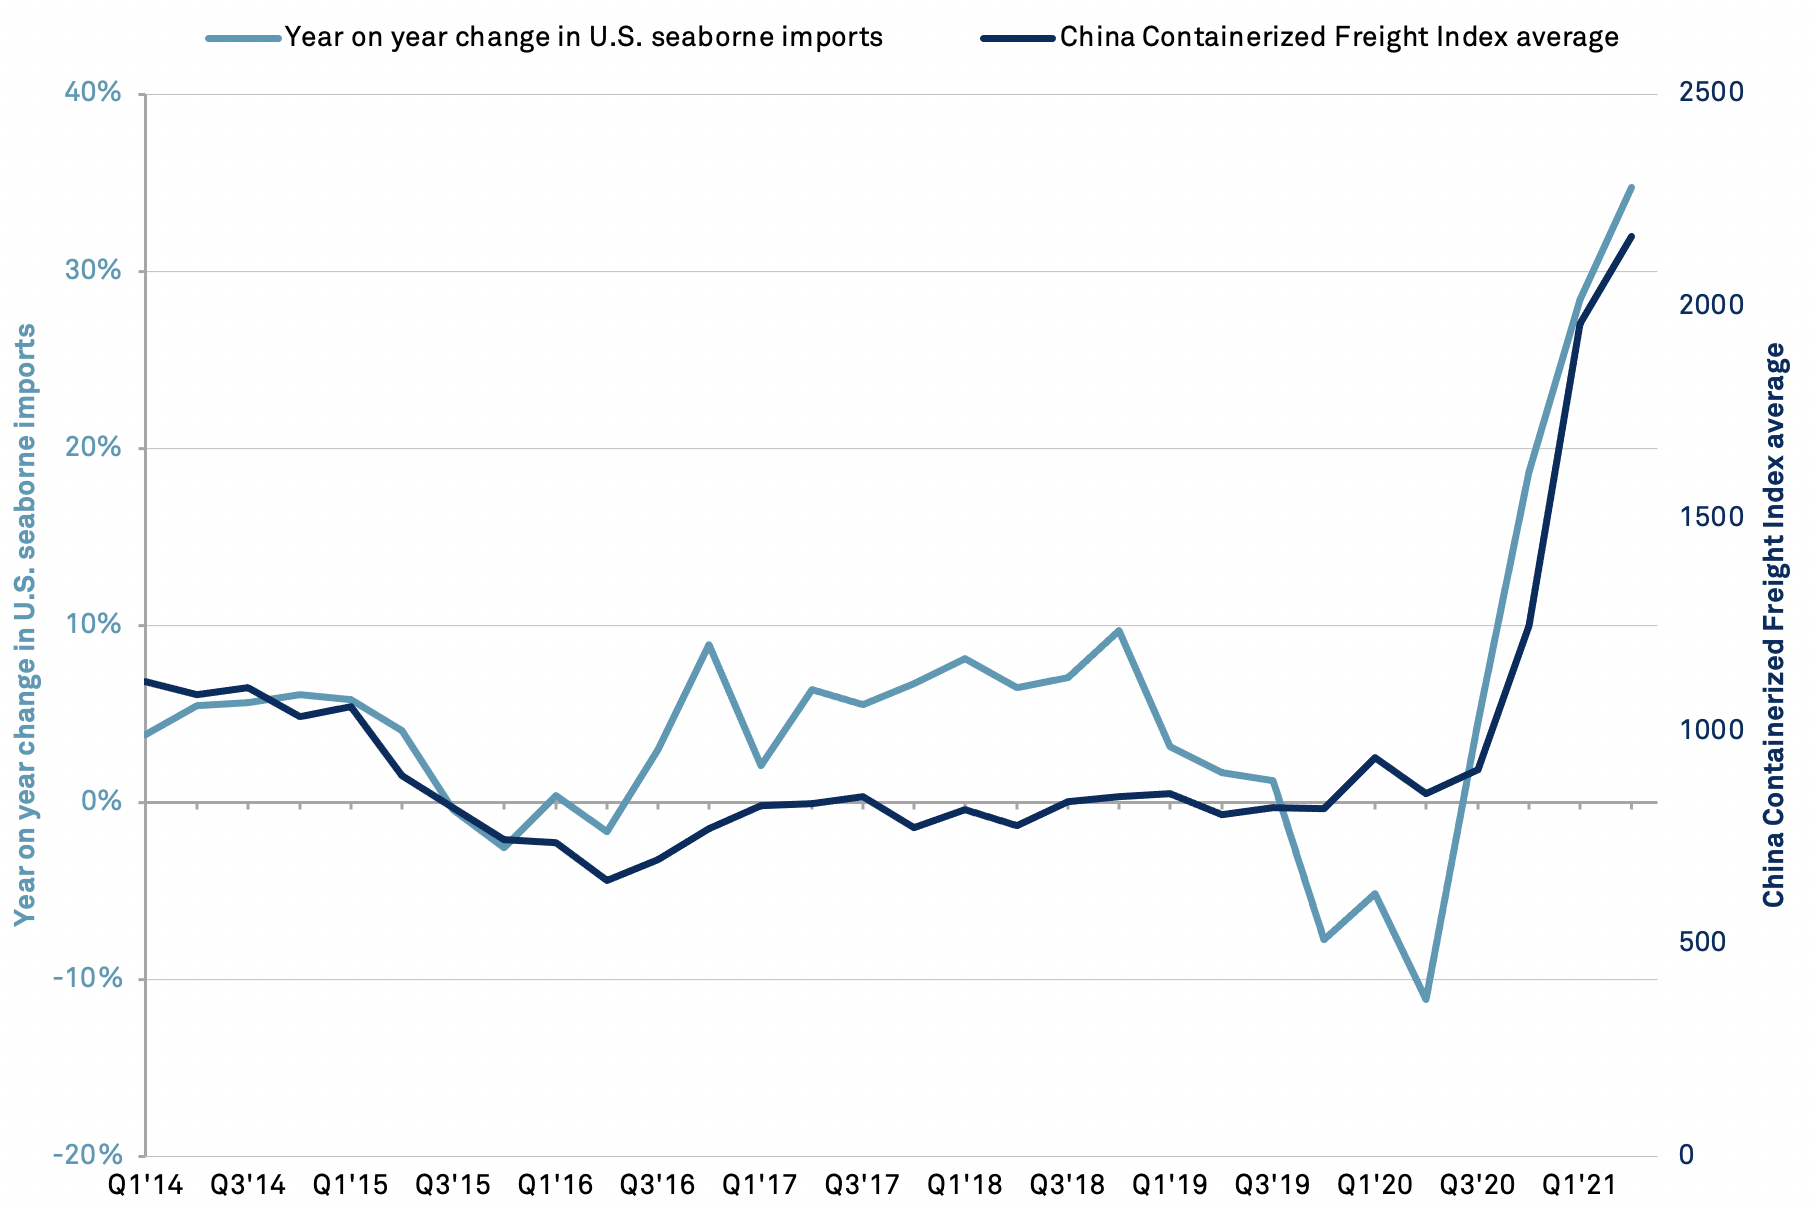
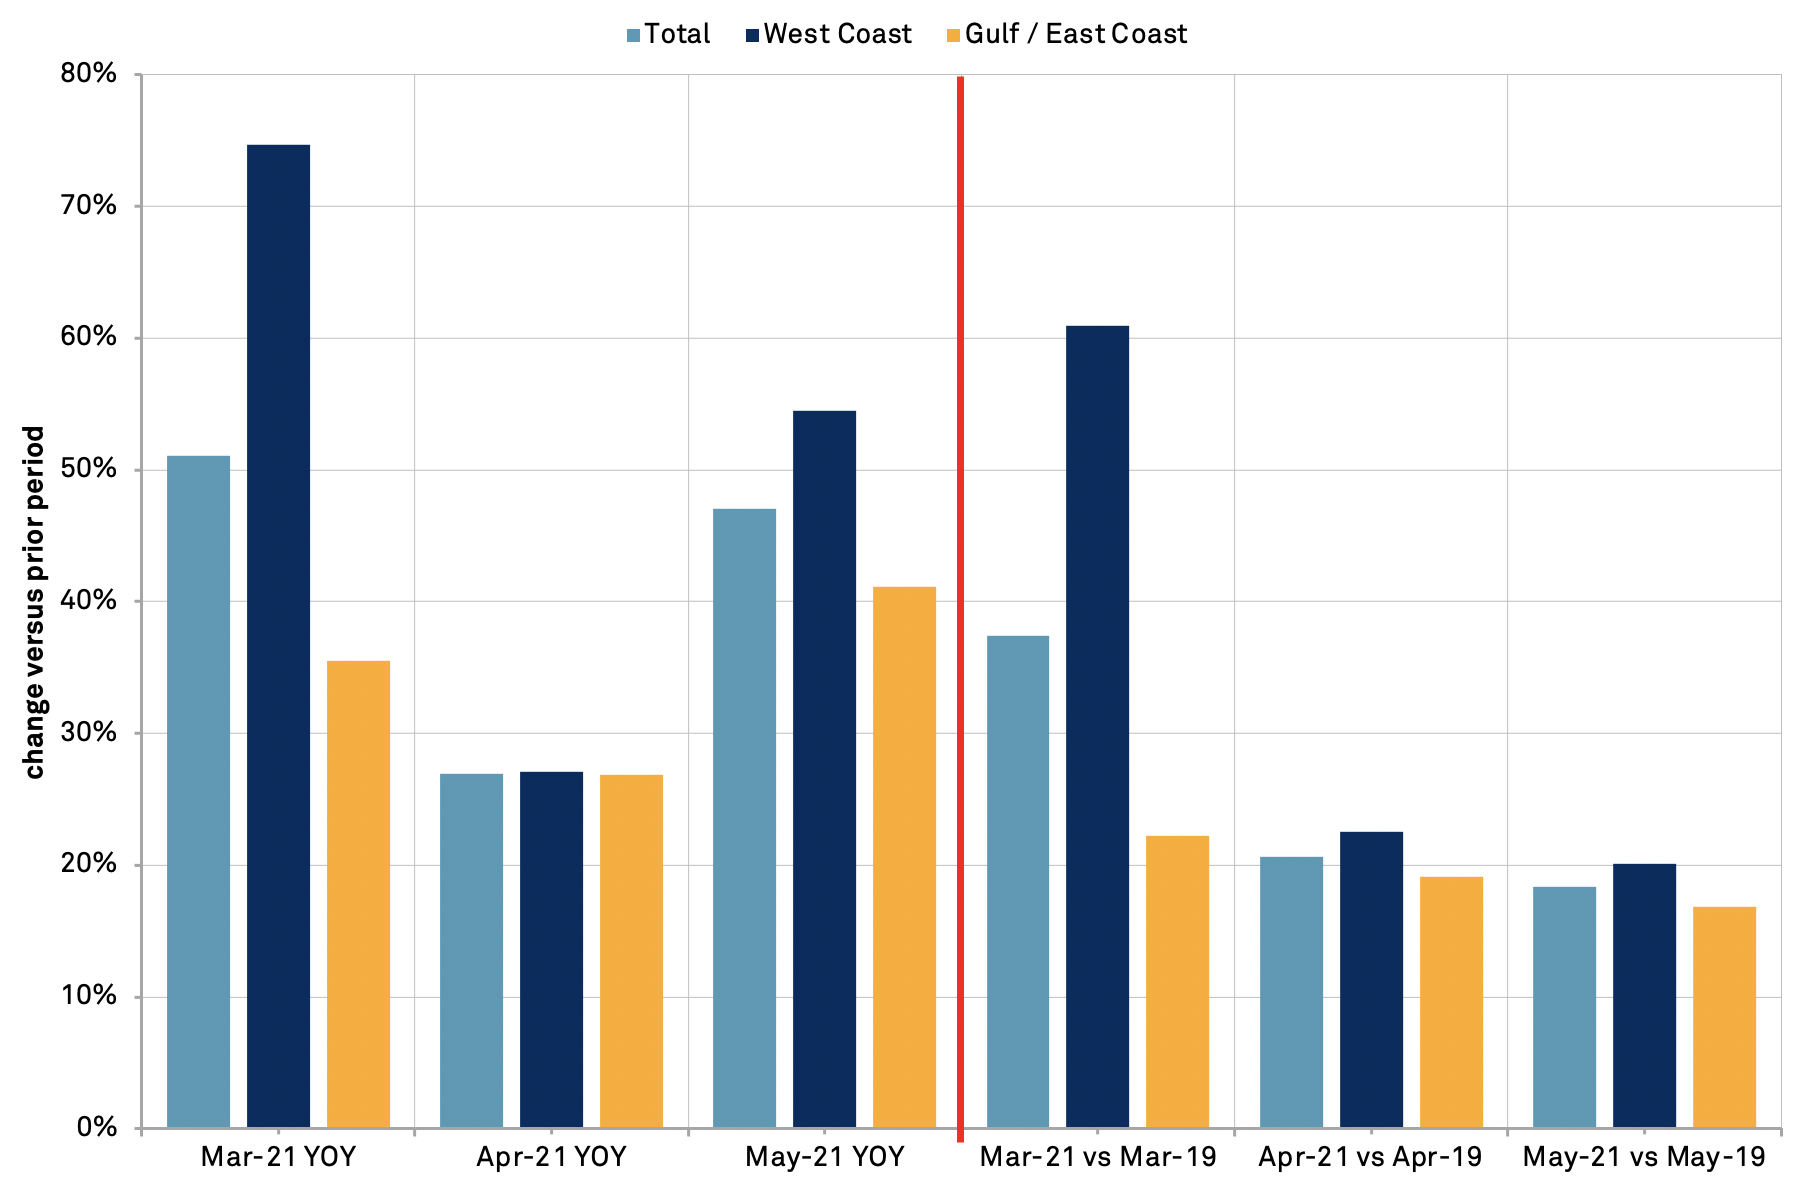
Container lines operating U.S.-inbound routes had another bumper month in May with total imports that rose by 47.1% year over year and by 25.0% compared to the same period of 2019. There are significant challenges ahead, however. In the short term, shipments from ports in southern China hav... Read more →
ZIM Shipping expects growth, rates to remain elevated in rest of 2021
ZIM Shipping reported Q1’21 revenues which surged 111.9% year over year as the container line increased its volumes handled by 28.2%. That outstripped Maersk’s 5.7% and Hapag-Lloyd’s 2.6% as the firm added new routes. The firm achieved a 76.4% rise in average shipping rate... Read more →
Container congestion not going away as supply chains stressed beyond the max
The container shipping industry’s congestion challenge “is not going to go away” according to FMC Chairman Daniel Maffei and an “import boom” has “stressed our supply chain to the max and beyond”. The import boom can be seen in a 50.6% year over yea... Read more →
Contact
Phone | |
Address | |
City | |
Country Name |